![]()
All the boss wants is to know how the project is going. She’s not interested in the task specifics. She wants to know if the project is on track or not.
Of course, who manages just one project these days? You need to be able to show all your projects together.
2 little reports will do the trick for you: the Project Gantt Chart and a customized Projects list.
Start with the Projects list.
Go to My Office > My Projects > My Assigned Projects.
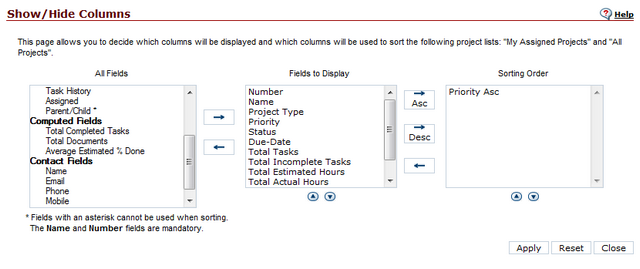
This page shows all the projects you’re assigned to. You can customize the look of this list to show computed fields like Actual Hours and Estimated Hours.
I suggest you choose these fields:
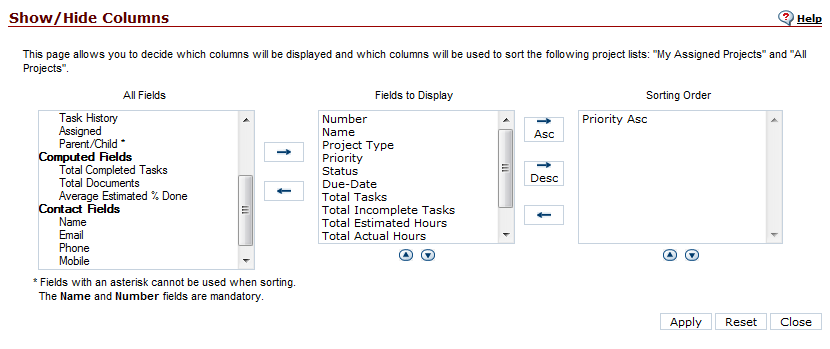
This will give you a nice report that you can simply print or export to Excel:
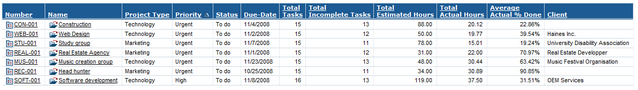
A Projects report like this takes 5 seconds to make – you won’t need to reset the columns once you’ve done it. It’s dynamic, so the data is always up-to-date. It tells you instantly how on budget or off budget you are.
And now for the Gantt
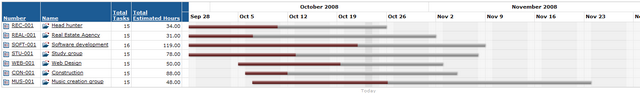
For bosses who want it even simpler and more visual, go for the project Gantt chart. Go to Administration Light > Gantt Charts > Project Weekly View. Each project is shown as a bar, so it takes about one second to see which projects are on track and which are in trouble:
And now you’re done
Put these two reports in an email, print them, insert them in a PowerPoint presentation. It took you about 5 minutes, and you can go back to managing the project.
How do you make the chart graph in colors?
How do you increase the size of the font on the saved image.
Hello,
Control over the Gantt chart visual element colors is limited. You’ll notice that the Gantt bar progress indicator color is determined by the skin you choose in your “Edit my Profile” page (accessible through the avatar in the top right hand corner of screen).
As for your 2nd question, are you trying to print the Gantt? If so, you will need to use the print formatting options (for instance, choosing landscape mode rather than portrait mode) to optimize the readability of the text.
If I have misunderstood you in any way, please let me know.
Michel Deslandes
Sales, Customer Service and Technical Support
Contact Us