In our continual progression to build up features, the new Beta interface now includes a new Gantt chart view. Display a single project or multi-project Search or Quick link task results in the Gantt chart view and apply filters as needed.
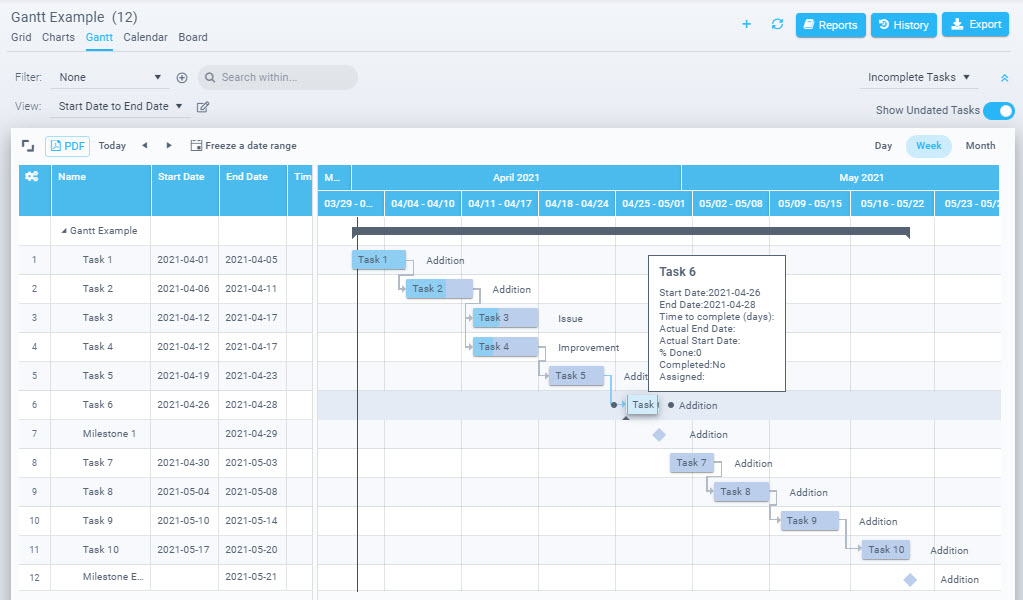
While keeping the overall features of the current Gantt chart as in the Classic interface, a number of enhancements have been added:
Better viewing/printing options
- The beginning and end of projects (or status grouping) in the Gantt are represented by a summary bar and contents can be collapsed/expanded, as needed.
- Choice of a date range to freeze to as well as exporting the view to PDF allow more flexibility.
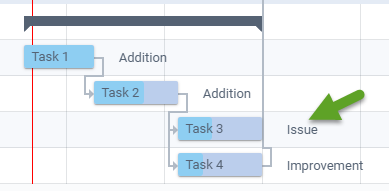
- The task bars can be attributed with a label of your choice as well (Assignee, task name, etc)
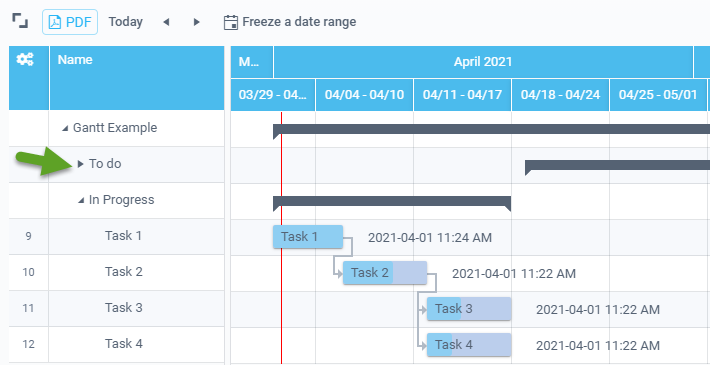
Use different date fields (Timeline view)
Not only Estimated start and end dates can be used. Choose any date field available, such as: Actual dates, created date, last updated. Using a date such as the created date provides a new perspective of your information in a timeline, rather than a task list in the grid.
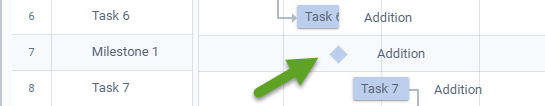
View as Milestone
Any task having just an end date will be displayed as a Milestone (represented as a diamond icon). No special qualities are yet associated with the Milestone.
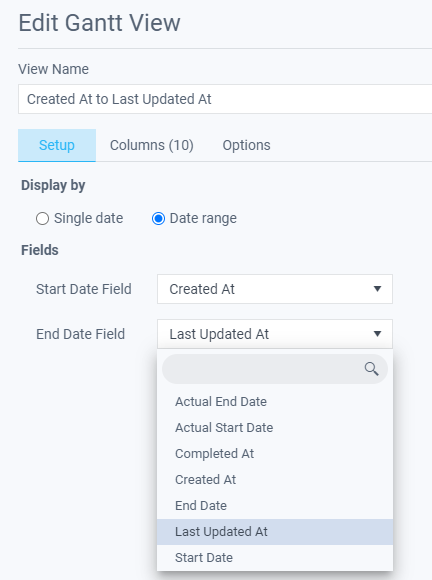
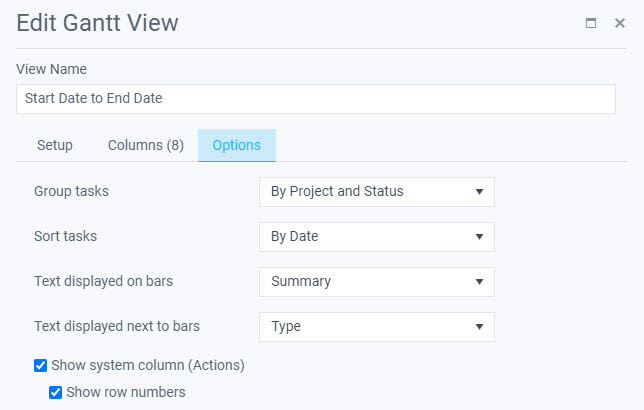
Gantt Chart Options
Access the settings through the Edit Gantt view edit icon. Set the 2 date fields to use on the Setup tab, fields to include in the view on the Columns tab, and other parameters from the Options tab such as how to group and sort.
Leave A Comment