When planning a project, we usually try to schedule tasks from memory, trying to fit dates. And then, when something new has to be done and we try to fit it in the schedule.
Gantt charts are not just a great way to report on the advancement of a project. They're a great planning tool. You can instantly see if there is a whole in someone's schedule to add a task.
Visualize workload
Just make a Gantt chart that shows someone's workload, across all projects.
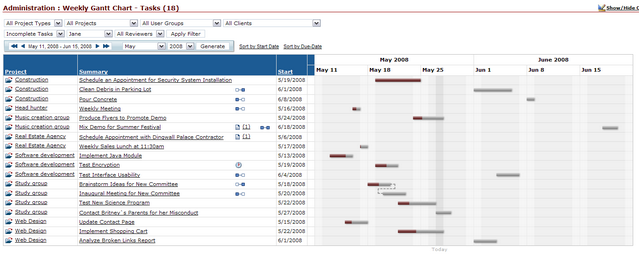
Maybe you would prefer to see it sorted by date, instead of by project? It certainly looks cleaner this way:
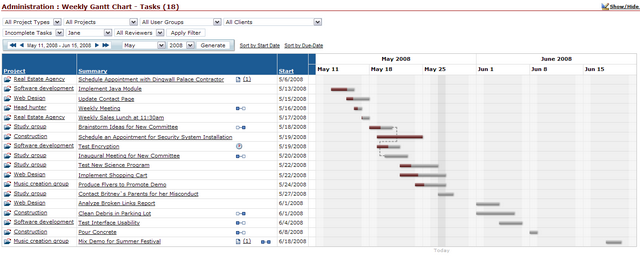
With a chart like that, you instantly know if you can fit something else in Jane's schedule. In this example, we can see that Jane has some free time towards the end of this week, and in the week of June 8.
Create a project visually
Or, when setting up a new project, work directly from the Gantt chart. When you add tasks directly form the Gantt, it makes it very easy to organize your project.
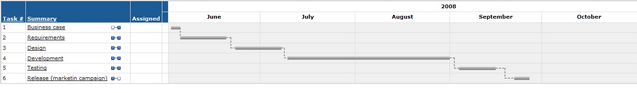
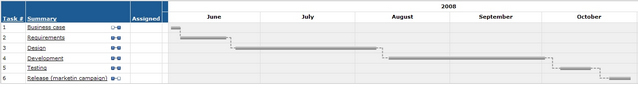
Also nice is the visuals of task dependencies. If a task in the project needs to be moved, all its dependents will all move with it, which makes it easy to see the impact of changing a date.
Visual is better
In the end, it all comes do the fact that our eyes are better at understanding something quickly. With abstract concepts (like time), it's hard to have a bird-eye view of the project, unless it's put in visual form.
Leave A Comment